This substack post is to supplement my video on nuclear power economics and go into more detail as to why the economics of nuclear are so poor and what nuclear needs to get to, to be competitive.
This video took much longer than anticipated to make because I wanted to simply the analysis. Unfortunately when you do so, Nuclear gets destroyed on the economics, and I’ll show you what I mean later.
At the beginning of the video, I’m mostly talking shit, it’s a lot of fun to joke about nuclear energy. Don’t take it too seriously.
This is followed by
Economics Terminology
CAPEX
Physical inputs to build a facility - concrete, steel, labour (in construction). Think of this like all the inputs to building a house
OPEX
What does it cost to maintain the facility - staff, fuel, maintenance, etc. Using the house example again, it’s like repairing a dishwasher, or mowing the lawn, buying cleaning supplies.
Net Present Value (NPV)
Definition: “Net present value (NPV) is the difference between the present value of cash inflows and the present value of cash outflows over a period of time. NPV is used in capital budgeting and investment planning to analyze the profitability of a projected investment or project.”
Which basically just means normalizing future cashflows to today’s money to show that money is more valuable sooner rather than later. With an example in the video.
Formula is
You can include the “- initial investment” portion if you are looking at the investments for long term analysis. Which is what I did for this analysis
Discount Rate
This is how much you are discounting the NPV by. There is discrepancy here, as nuclear institutions suggest it should be 3%. I disagree strongly if we want nuclear to get investment outside of governments. Typically this is set to 7-8% which is the average stock market return. There’s an argument to be made that lower values can be used for utilities, but that’s not very appealing as institutional investors will want higher returns and take their money elsewhere.
Additionally, nuclear is already considered risky so to mitigate said risk I’d argue its discount rate should be higher, not lower.
Cumulative Cash Flow
Aggregate for profits and costs over time.
Definition: “IRR, or internal rate of return, is a metric used in financial analysis to estimate the profitability of potential investments. IRR is a discount rate that makes the net present value (NPV) of all cash flows equal to zero in a discounted cash flow analysis. “
This is just the return on investment you want, higher is better because it means you brought more money forward faster.
And this is where nuclear runs into trouble because if you’re arguing for lower IRR or discount rates, then systems that can post higher ones will always be more attractive to investors.
If nuclear wants to compete on the free market and reap the cost benefits of competition it will need high IRR’s full stop.
And three topics I didn’t explicitly state
Debt
Just the loan you take out to build a facility in my analysis it was 60% of costs
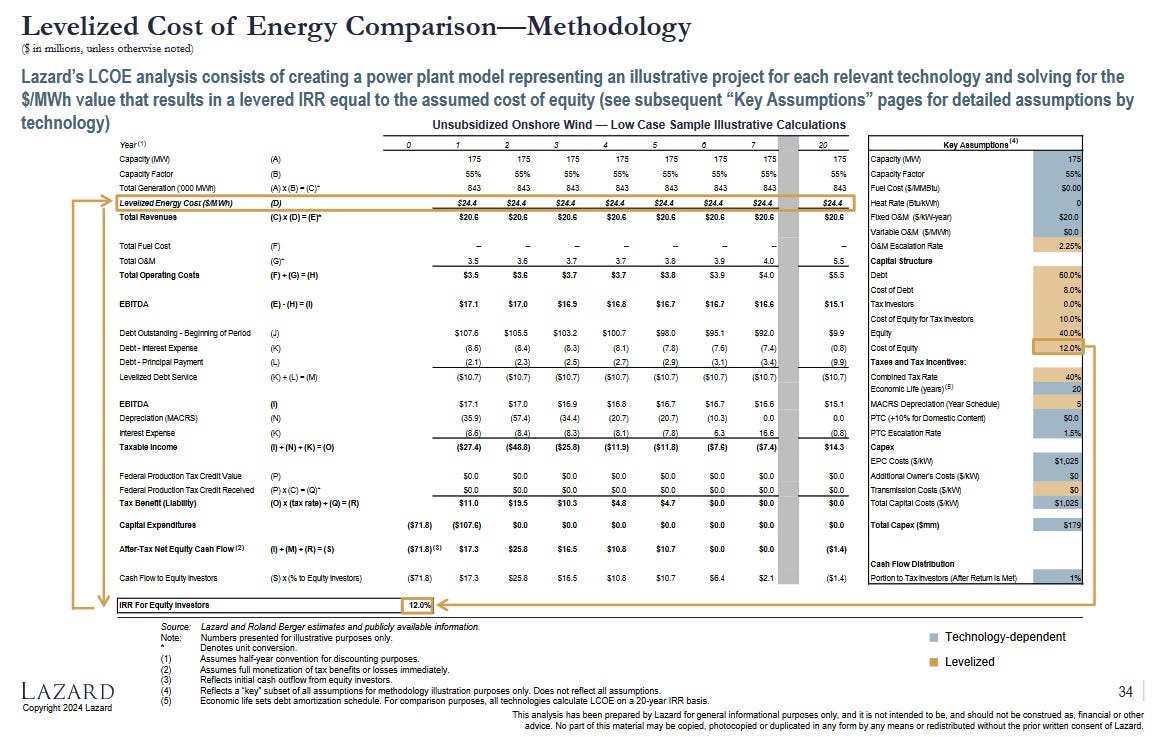
In LAZARD’s study this was 8% aligned with market value
Equity
The money that investors are fronting either through stock or other means. It was 40% of the costs
In LAZARD’s study this was 12% showing that investors expect higher returns.
Weight Average Cost of Capital (WACC)
It’s to find the expected rate of return when including both debt and equity
Again here I’d argue the higher the returns the better. Since solar and wind can achieve these high returns we’re not doing nuclear any favors by assuming lower ones, that will neuter any chance of private capital coming in.
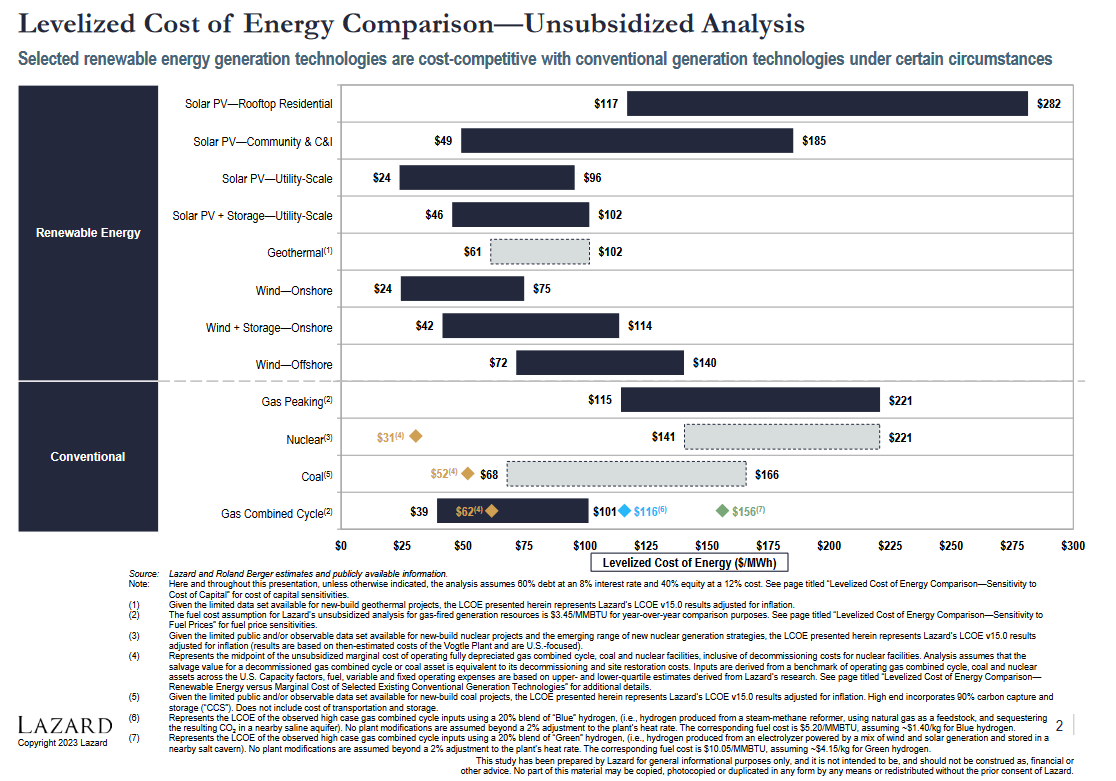
LAZARD Study
To do this analysis I built an Excel sheet to align with LAZARD analysis (2023 and 2024 more on that later). But since most pro-nuclear advocates like to argue that renewables only last 20 years while nuclear lasts 60, so I extended their analysis.
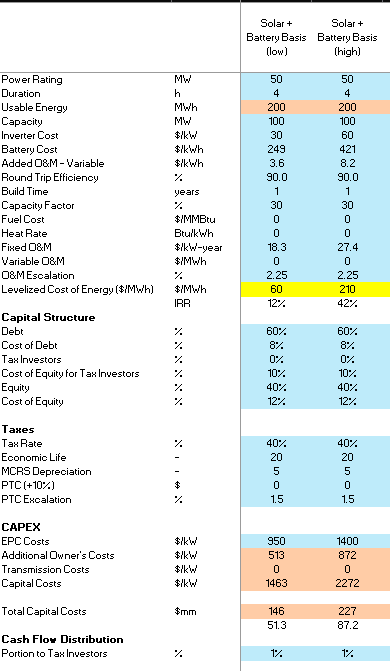
This is where I need to get into the weeds a bit. You’ll see that solar + battery storage has skyrocketed in price from the 2023 to 2024 versions. And my analysis focuses on solar + 4 hours of battery storage because that’s the minimum required storage for RE to work with transmission.
Where the range went from: 46-102 $/MWh to 60-210 $/MWh
It is NOT explicitly stated onto why this has happened, so I am inferring here but this is my logic.
The 2023 study seemed to only look at 4+ hour storage
The 2024 study seems to look at 1-4+ hour storage scenarios
I was able to normalize my analysis to their data on the low end, but not on the high end
You can see that I achieved the correct IRR for LAZARD 2024 for the low end (just had to increase solar cost a bit from 850 to 950), but I’m way off for the high end doing the same thing. It looks like the CP is constant at 30% but if I move it down to solar’s low end of 15% then IRR drops to 16% much closer. Pair this with 1 hour storage rather than 4 hour and we might get the right answer?
Anyway, this is one area where I found mismatch, but I chalk it up to not knowing all the gears turning behind the LAZARD analysis though I’m otherwise happy. So if you have a suggestion on why this might be happening that’d be great.
4-hour storage costs and solar panel costs went up a bit from 2023-2024 but nothing to justify the increase
We can see that the storages costs didn’t change much average of 228 $/MWh in 2023 and 233 $/MWh in 2024 at 4 hours of storage. While solar costs were 1,050 $/kW in 2023 and 1,125 $/kW in 2024 on average for utility scale.
All of this is to say, my analysis when I say average solar and average wind is using mid-point capacity factors and mid point battery costs for 4 hours of storage. This makes the results much closer to the 2023 study than the 2024 one. I’m not 100% sure why the 2024 study has as much spread as it does, and it would be nice to get some clarification. But I’m happy with the numbers as they align with expectations.
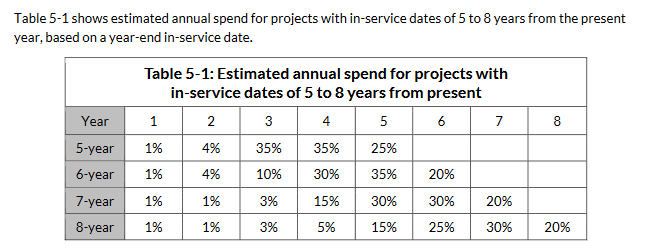
LAZARD does a number of other things to do their analysis. With a couple of notes. Since renewables are assumed to be built in 1 year this means all the equity comes in that year. But in the case of nuclear I had to assume a rate at which equity is injected. This was not provided so I used the MISO report for transmission lines. This actually worked really well and modeled nuclear correctly.
Now with that out of the way I can focus on my analysis.
Economic Analysis of RE vs Nuclear
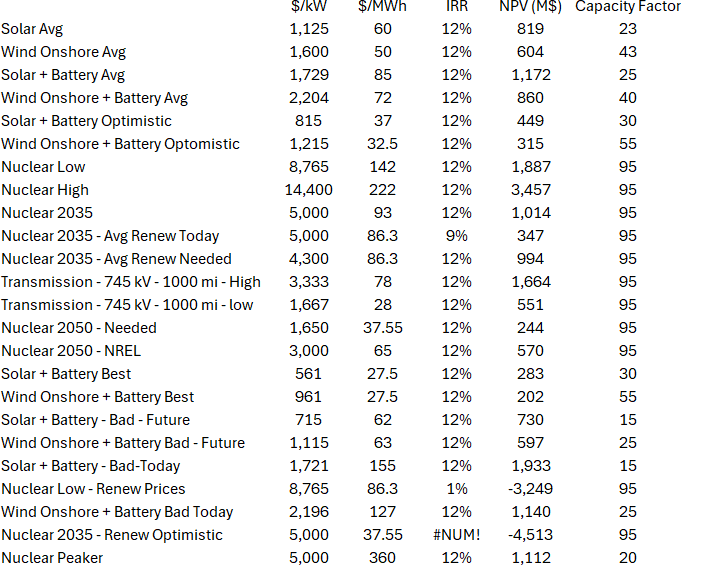
I did a whole host of scenarios you can see the variables below:
The reason I needed to align with LAZARD is so that I could do subsequent changes to the economics to figure out what nuclear needed to be. So once it was set up that part was easy. The only thing I changed was that after the economic life of a project ie 20 years for solar or wind. I would “repower” the systems. Which just means replace old with new. I assumed 50% of the original CAPEX to do so as, you’d already have the lands, footings, hook-ups etc. And you’d only be replacing broken things. This was my methodology
Test the analysis on the known data. Since I should get the same results as LAZARD 2024
This worked for the most part excluding the high cost battery storage from above but everything else worked great.
I was able to use this analysis to also estimate transmission line costs.
I did two cases both using 625+ kV lines rated at 3,000 MW and 1,000 mi long
First at 10 M$/mi which is insanely expensive.
Second at 5 M$/mi which is near the high end of most estimates (a bit under MISO currently which includes a 30% contingency)
I feel that these cases are very fair and would both be overestimated if we give the same grace of “deregulation” that we’re giving to nuclear.
Regardless I assumed that 10% of power would come from transmission, aligning with the literature on this subject. In the worst case that means adding 8 $/MWh to your power costs while the lower case is 3 $/MWh.
By adding transmission and batteries we are able to compare nuclear and renewables more accurately and this at least brings us to energy systems that are at least 80% solar and wind. Which is well defined in the literature and something that Karl (my debate partner) and I agree on.
This is because renewables are able to even variability if you can transmit energy long distances.
This can be shown below where “a” is 100% build case for renewables, then backup power is around 10% when energy can be transmit 3,000 km (this doesn’t have to be continuous either, it just means how far is energy interconnected so you could push power from Spain to southern France then northern France pushes power to Ireland, but more generally this is modeled as hubs that then distribute power for domestic use)
In case “b” the back-up required is 5% with a 30% overbuild.

Steinke et al Energy Transmission This is why I generally state that 80% is achievable pretty easily then anything past that requires more extensive interconnectivity. And then that becomes a cost modelling problem. Where you trade off various cases.
Anyway this is to say that you can achieve high levels of renewable penetration that eats away at any presence other systems might have. And the remaining share will be divided up by other systems like hydro, nuclear, natural gas with CCUS, geothermal, etc.
Now you might see why I love cost modelling so much.
This discussion is also what pisses me off the most when I argue with nuclear power advocates because they don’t seem to understand how to implement renewable energy systems, and then default to nuclear. (To clarify not Karl who I’m debating)
After I was happy with the analysis I just started playing with variables to see how well nuclear would do against various scenarios as shown in the video. Normalizing everything to a 12% IRR except in the cases where I wanted to see how nuclear would fair if it competed with renewable energy prices.
I won’t show cash flows because they are all over the place and the “best” cases actually have the lowest cash flows because the prices are the lowest which is good for both the investor (less capital invested for equivalent returns) and the consumer (lower prices drive economic development)
Here are the generalized outcomes, where $/kW is the CAPEX (of everything), $/MWh is the charge rate, and the rest are self-explanatory.
If you are curious about another scenario just let me know and I’d be happy to test them on stream.
When an item has something like (Avg Renew Today) then I’m comparing it to average renewable prices with batteries plus transmission costs either high or low (10% of shown value)
This analysis was designed to compare renewables to nuclear head to head, expect for the last case which was Nuclear Peaker, where CAPEX and charge rate can be much higher if it’s only operating what I assumed 20% of the time.
Overall nuclear at least needs to hit 4,300 $/kW to be competitive with current renewable systems. Which at best is a 50% reduction in costs from today (for OECD countries)
But as I state in the video if costs fall to 600 $/kW for solar, 1,000 $/kW for wind and 100 $/MWh for batteries then we’re sitting at the optimistic case (with high capacity factors). This could very well happen by 2035, in which case I think nuclear is fucked.
Overall my analysis is aligned with the Nuclear Energy Agency (NEA) which states that nuclear needs to be sub 2,000 $/kW to be competitive, so overall I’m happy with the results.
Learning Rate
Learning rate is super important because it defines at what rate we can expect nuclear power costs to come down and if my doom and gloom position is accurate.
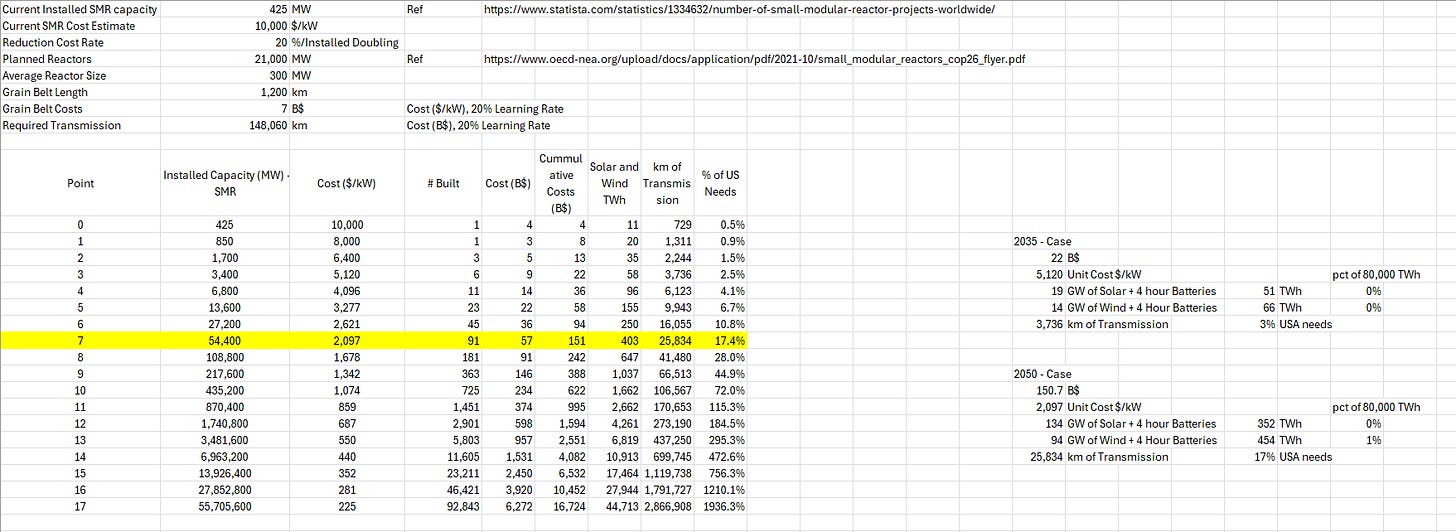
This analysis is super simple cause it’s just a function of if you double the capacity of some system then then costs reduce by X amount. Solar has been around 20%, so nuclear. I did 3 cases at 20% (solar), 12% (wind), and 7% (stated nuclear). I compared these prices against whether you had invested that money in renewables or transmission.
So if nuclear has a learning rate of 20% we’re golden! I’m on team nuclear easy. Even if it’s at 12% I’d be cautiously optimistic, but would generally see it as a positive and worth the investment. However, if it’s 7% which is more aligned with the literature on the topic, then it has no chance and it’d be a waste of resources.
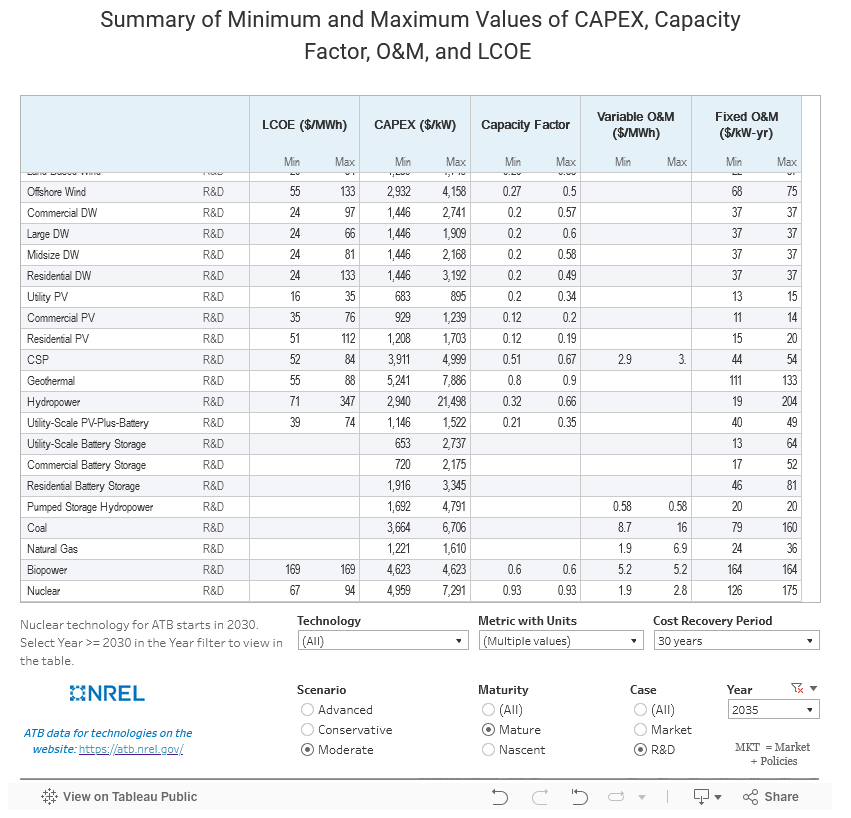
I don’t know what the answer is, but given institutions like NREL are expecting costs to come down to 2,000 $/kW (rather 3,000 $/kW by 2050) I’m not optimistic about nuclear’s future. And that’s because capital costs are a function of physical inputs which are similar for coal, natural gas and nuclear.
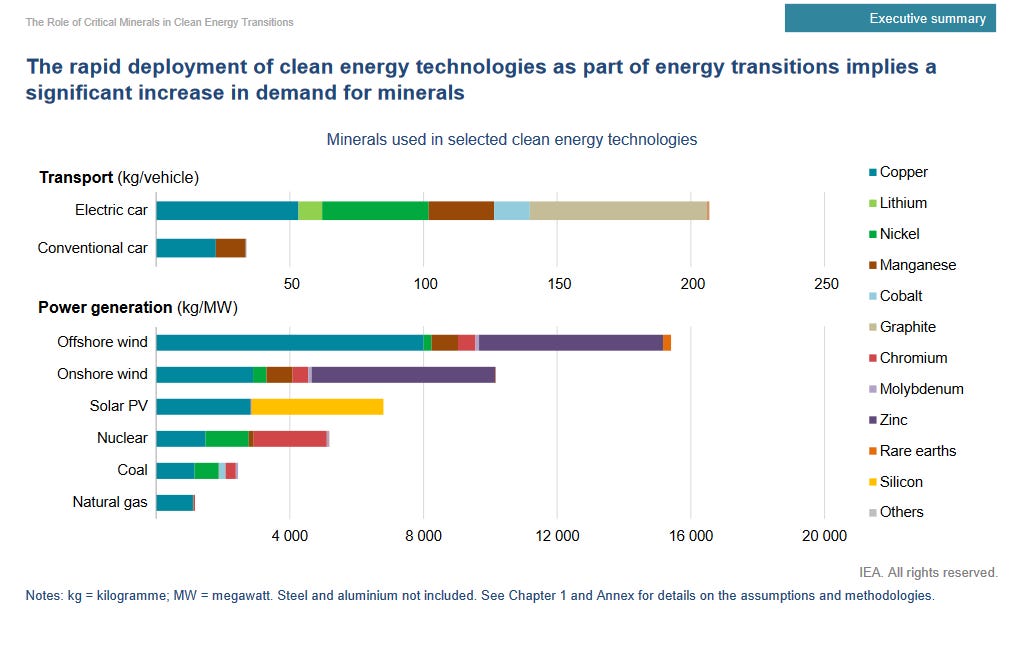
So the physical inputs are similar to nuclear requiring more critical minerals. For systems that are all essentially steam engines. It is fair to use their costs as a proxy while noting that there are reasonable regulations that require nuclear to be safer than these options (we can quibble if all are necessary but at the very least the standard should be higher)
So if we compare the 2035 values that NREL estimates for different system costs, then I don’t think it’s fair to assume that renewables will be lower than coal given how similar its systems and inputs are.
Nuclear advocates like to say that nuclear used to be 600-900 $/kW in today’s dollar in the 1960’s, but seeing as we’re not seeing this for even nat gas or coal, that seems like a pipe dream. However if nuclear hits 900 $/kW I would be fucking ecstatic. I really don’t care which energy system “wins”. I care about putting resources in the right place to create the lowest-cost power and decarbonize the economy.
But we need to be pragmatic about the solutions being proposed and weigh the probability of success. As of right now, that means focusing on renewable systems until proven otherwise. But in the meantime, we should remove stupid nuclear barriers that drive up costs unreasonably and push some level of funding (if you have funding for energy transition using public money then I’d argue 5% should go to nuclear about the proportion I’d expect it to represent) into nuclear power. If nuclear loses I want it to lose in a fair fight. But I personally think it’s too little too late, and my 5% estimate would be too much if the cost cannot come down significantly.
If you want to convince me otherwise the economics are going to be the best way to do so.

